Your sales team just closed 200 new customers this quarter. The Slack channel is full of celebration emojis. Your board deck shows impressive growth metrics. But three months later, you’re staring at your bank account wondering why you’re burning $400K monthly despite all that “success.” Here’s what nobody told you: those 200 customers cost you $1.2 million to acquire, and at $250 average monthly revenue per account, you won’t see that money back for 24 months. You just bought yourself two years of negative cash flow, and your runway is 14 months.
This scenario plays out every day in SaaS companies that confuse growth with sustainability. Your CAC payback period the time it takes to recover what you spent acquiring a customer might be the single most important metric you’re not tracking correctly. Get it wrong, and you’ll run out of cash before you figure out what happened.
The Silent Killer: Why CAC Payback Matters More Than You Think
CAC payback determines whether your growth is sustainable or suicidal. When your payback period is too long, you enter a cash flow death spiral. Every new customer you acquire makes your financial position worse, not better. You’re essentially taking out a loan with every sale, and the longer the payback, the more capital you need to keep growing.
The math is brutal. If your payback is 18 months and you want to add 100 customers next quarter, you need enough cash to cover 18 months of negative cash flow for all 100. Scale that to 500 new customers, and you’re looking at millions in required capital before you see a dollar back. According to CB Insights analysis of failed startups, running out of cash is the second leading cause of failure, affecting 38% of companies. Poor unit economics specifically not understanding when customer acquisition becomes profitable sits at the heart of most cash crunches.
Yet founders obsess over MRR growth, logo counts, and pipeline value while ignoring the metric that actually determines if they can afford their growth. Investors have learned this lesson the hard way. The 2022-2023 SaaS correction wasn’t just about multiples compressing. It was about companies with 24+ month payback periods suddenly losing access to cheap capital. When your business model requires continuous fundraising to survive, you don’t have a business you have a dependency.
Your CAC payback reveals the truth about your business model. Can you self-fund growth from customer revenue, or are you permanently reliant on external capital? The difference between 8 months and 18 months payback is the difference between a capital-efficient machine and a cash incinerator.
What CAC Payback Period Actually Measures
CAC payback period tells you how many months of gross profit it takes to recover your customer acquisition cost. That’s it. Not revenue gross profit, which accounts for the actual costs of delivering your service.
The formula is straightforward: CAC ÷ (Monthly ARPA × Gross Margin %)
Let’s break down each component. CAC (Customer Acquisition Cost) includes everything you spent to acquire customers: sales salaries and commissions, marketing expenses, marketing and sales software tools, advertising spend, content creation costs, and even a portion of overhead allocated to sales and marketing. If someone touches the customer acquisition process, their cost goes into CAC.
ARPA (Average Revenue Per Account) is typically calculated monthly for this metric. Take your monthly recurring revenue and divide by your number of customers. Simple. But here’s where people mess up you need to use the ARPA for new customers specifically, not your entire customer base. Existing customers who’ve expanded skew your numbers.
Gross margin percentage represents how much revenue you keep after covering the direct costs of service delivery. For SaaS companies, this includes hosting costs, payment processing fees, customer support costs directly tied to usage, and any variable costs that scale with customers. Most SaaS companies run 70-85% gross margins. If yours is below 70%, you’ve got a different problem to solve first.
Here’s a simple example: You spend $5,000 to acquire a customer (CAC). That customer pays you $200 monthly (ARPA). Your gross margin is 80%, meaning you keep $160 after direct costs. Your payback calculation: $5,000 ÷ $160 = 31.25 months. That’s concerning. You won’t recover your acquisition cost for nearly three years, which means you need enough cash to float every new customer for 31 months before they become cash-flow positive.
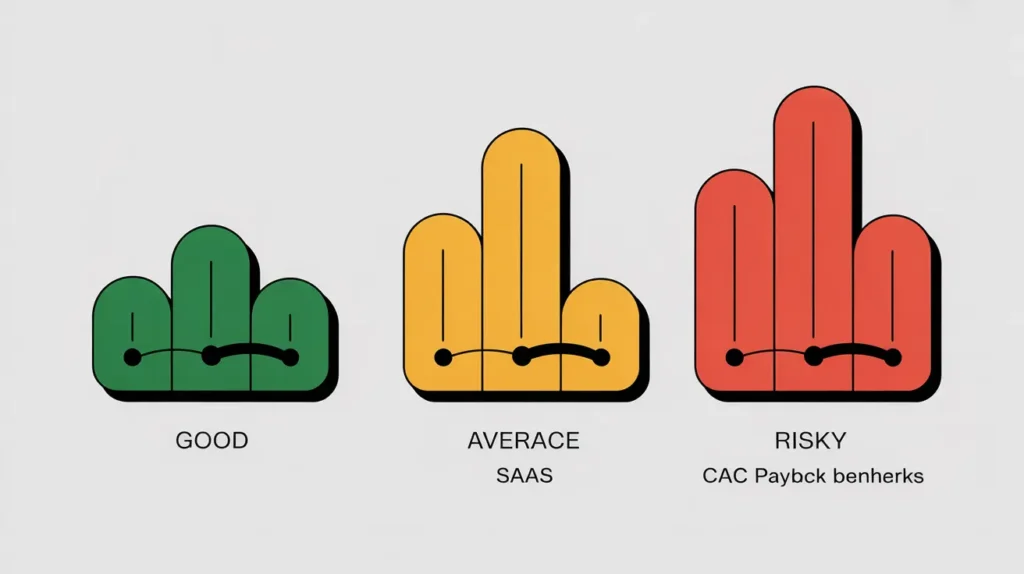
The Good, The Bad, The Dangerous: Benchmarks Explained
Not all payback periods are created equal. Where you land on the spectrum determines your capital requirements, growth potential, and frankly, whether you have a viable business.
Excellent (5-7 months)
This is product-led growth territory. Companies achieving 5-7 month payback typically have viral mechanisms, minimal sales friction, or incredibly efficient acquisition channels. Slack in its early days hit 6-month payback through word-of-mouth growth and a self-serve model that required almost no sales support. Dropbox’s referral program drove payback under 6 months during its explosive growth phase.
These companies share common characteristics: freemium or free trial models that require minimal human touch, natural network effects where users invite other users, low-touch sales processes (often entirely self-serve), and efficient digital marketing channels as primary acquisition. At this payback range, you can self-fund aggressive growth. Every dollar of gross profit quickly returns to fuel more acquisition.
Good (8-12 months)
This is the sweet spot for most healthy B2B SaaS companies. Payback in this range means you’re capital-efficient enough to grow without constant fundraising, but you’re investing appropriately in sales and marketing to capture market share. You can maintain reasonable growth rates while building a sustainable business.
VCs targeting SaaS investments typically look for companies in this range. Why? It balances growth and efficiency. You’re investing enough to win customers, but not so much that you’ll need endless capital raises. Companies at 10-month payback can often reach profitability or cash flow breakeven while still growing 50-70% annually.
Acceptable (13-18 months)
You’ve entered enterprise SaaS territory. Longer sales cycles, higher contract values, and more complex implementations push payback periods out, but that’s okay if the economics support it. When you’re selling $100K annual contracts with 95% gross margins and 120% net retention, an 18-month payback can work.
This range requires more capital to scale, but it’s manageable if you have strong unit economics elsewhere. Your customers need to stick around long enough to make the investment worthwhile. If your average customer lifetime is 3-4 years and you have solid expansion revenue, 15-month payback is defensible.
However, you need to be honest about capital requirements. At 18 months, acquiring 1,000 new customers annually requires you to cover 1.5 years of negative cash flow for that entire cohort. That’s millions in required capital for most SaaS companies.
Problematic (18+ months)
When payback exceeds 18 months, alarm bells should ring. You’re in rare territory where the math only works under very specific conditions: enterprise contracts with multi-year commitments upfront, extremely high lifetime value (5+ years, substantial expansion revenue), low saas churn rates (sub-5% annually), and access to patient capital that understands the model.
One B2B SaaS company we analyzed had 26-month payback but survived because they sold 3-year contracts paid annually upfront. The upfront payment compressed the actual cash payback to under 12 months, even though the gross margin payback calculation showed 26 months. This is the exception that proves the rule.
For most companies, 24+ month payback means you’re one funding crisis away from disaster. Your growth rate needs to slow enough that you’re not constantly drowning in acquisition costs, which means you’re limiting your own potential just to survive.
Important note: These benchmarks assume net new customer acquisition only. Expansion revenue from existing customers changes the math entirely. A customer who starts at $500 monthly but expands to $2,000 over 12 months has a dramatically different payback profile than these numbers suggest.
Why Your CAC Payback Might Be Misleading
Most SaaS companies calculate CAC payback incorrectly. These five mistakes create a false sense of security that leads to poor decisions.
1. Not Including All CAC Costs
Your sales rep’s salary isn’t free. Neither is HubSpot, ZoomInfo, your SDR team, or the portion of your office space allocated to sales and marketing. Yet many companies only count direct marketing spend and commissions in their CAC calculation.
One Series A company we worked with thought their CAC was $3,200 based on marketing spend and commissions alone. When we included full-loaded sales salaries, marketing tools (adding up to $18K monthly), sales enablement costs, and allocated overhead, their real CAC was $6,800 more than double. Their payback went from a respectable 11 months to a concerning 23 months overnight. The business model didn’t change; they just finally measured it correctly.
Here’s the right approach: Add up all sales and marketing expenses for a quarter. Include salaries, benefits, tools, software, advertising, events, content creation, agencies, and a reasonable overhead allocation (typically 10-15% of direct costs). Divide by the number of new customers acquired that quarter. That’s your true CAC.
2. Using Gross Revenue Instead of Gross Margin
This mistake makes your payback period look artificially short because you’re pretending you keep every dollar of revenue. You don’t. After hosting costs, payment processing, support costs, and other variable expenses, you’re keeping 70-85% of that revenue (for most SaaS companies).
Here’s the difference in practice: Your customer pays $150 monthly. Using gross revenue, with $4,500 CAC, your payback looks like 30 months ($4,500 ÷ $150). But you don’t keep $150. If your gross margin is 75%, you keep $112.50. Your real payback is 40 months ($4,500 ÷ $112.50) 33% longer than you thought.
The formula must be: CAC ÷ (ARPA × Gross Margin %). Always. No exceptions. Gross margin matters because it represents actual cash generation. Revenue means nothing if your costs eat up 40% of it.
3. Ignoring Customer Segmentation
Your SMB customers and your enterprise customers have completely different unit economics. Blending them together creates an average that describes neither segment accurately and leads to poor strategic decisions.
Consider this real example: A company had an 11-month blended payback that looked healthy. But when we segmented, their SMB customers had 6-month payback while enterprise customers had 22-month payback. The problem? They were investing heavily in enterprise sales based on the blended metric, not realizing enterprise wasn’t working. Meanwhile, their efficient SMB motion was being starved of resources.
Break down your payback by customer segment: company size, industry vertical, acquisition channel, sales motion (self-serve vs. sales-assisted), and contract size tiers. You’ll often find one segment is subsidizing another. That’s fine if intentional, but you need to know which is which. Your growth strategy should focus resources on segments with the best payback periods, not the largest logos.
4. Missing the Cohort Analysis
A single point-in-time calculation tells you where you are. Cohort analysis tells you where you’re headed. If your payback was 9 months last year and it’s 14 months today, your business is getting less efficient. That’s a problem even if 14 months is “acceptable.”
Track payback period by acquisition cohort (Q1 2024 customers, Q2 2024 customers, etc.). Plot the trend. Improving payback means you’re getting more efficient spending less to acquire customers or acquiring higher-value customers. Worsening payback signals trouble: rising acquisition costs, decreasing ARPA, or margin compression.
One growth-stage company celebrated hitting $10M ARR while their payback silently deteriorated from 8 months to 19 months over 18 months. By the time they noticed, they’d burned through most of their Series B raising money to fund unprofitable growth. The trend mattered more than any single quarter’s number.
5. Forgetting About Expansion Revenue
Net revenue retention changes everything. If your customers start at $500 monthly but expand to $1,200 within 12 months, your actual payback is much shorter than the initial calculation suggests.
Here’s how to account for expansion: Calculate your standard payback using new customer ARPA. Then model the impact of expansion by calculating the time to recover CAC when you include expansion revenue. If customers expand 30% in year one, your effective monthly gross profit is higher than initial ARPA suggests.
A company with $6,000 CAC, $300 initial ARPA, and 80% margins has an 25-month initial payback ($6,000 ÷ $240). But if customers expand to $450 ARPA by month 12 through upsells, the actual payback considering expansion is closer to 18 months. That 7-month difference is massive when evaluating business model sustainability. Track both saas metrics: initial payback (conservative) and payback with expansion (realistic for your cohorts).
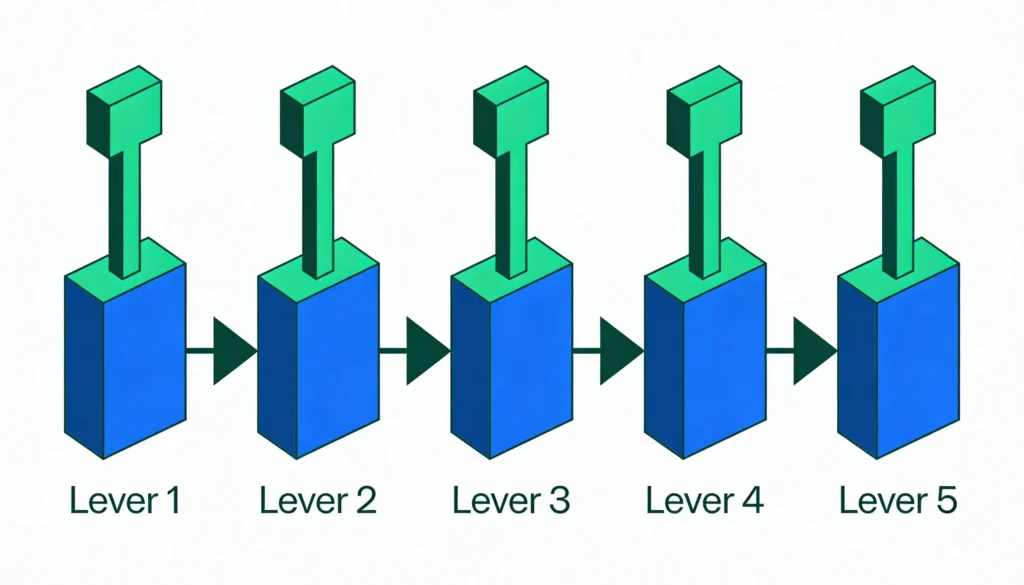
The 5-Lever Framework to Improve CAC Payback
You have five levers to pull. Most companies need to pull three simultaneously to see meaningful improvement.
Lever 1: Reduce CAC
This is usually the fastest lever to pull. Start with channel analysis. Calculate CAC by acquisition channel paid search, content marketing, outbound sales, partnerships, referrals. You’ll often find channels with 3-5x better CAC than others. One SaaS company discovered their content-driven trials had $2,100 CAC while paid search leads cost $8,400. They shifted budget accordingly and reduced blended CAC by 38% in two quarters.
Sales efficiency matters just as much. How many demos does your rep run before closing? How long is your sales cycle? One mid-market SaaS company reduced their sales cycle from 87 days to 52 days by implementing better qualification and a structured discovery process. That alone improved their payback by 40% because they could close more deals with the same sales capacity.
Specific tactic: Implement strict lead qualification scoring. Stop wasting sales time on prospects with <30% close probability. Your sales team touching fewer, better leads reduces CAC faster than most marketing optimizations.
Lever 2: Increase ARPA
You don’t need to raise prices (though you should evaluate that too). Often you can increase ARPA through better packaging and product-led upsells. Are you leaving money on the table by underpricing your higher tiers? Most companies are.
One approach that works: Create a premium tier with 2-3 high-value features bundled at 40-50% higher price. Position it as your recommended tier. Even if only 25% of customers select it, you’ve increased blended ARPA significantly. A company we worked with added a “Professional” tier at $299 versus their standard $199 plan. 31% of new customers chose it, raising ARPA from $199 to $230 a 15% lift that translated directly to shorter payback.
Usage-based pricing can also drive ARPA expansion within the initial contract. If customers can start small but grow based on usage, your effective ARPA increases naturally as they get value.
Specific tactic: Run a pricing analysis on your last 100 customers. What would happen to revenue if you increased prices 15-20% for new customers only? Most SaaS companies can raise prices with minimal impact on conversion but significant impact on unit economics.
Lever 3: Improve Gross Margin
Gross margin is the hardest lever to move quickly, but even small improvements compound. If you can move from 75% to 80% gross margin, you’ve shortened your payback by about 6% without changing anything else.
Infrastructure costs are usually the biggest opportunity. Are you over-provisioned in AWS? Can you optimize your database queries to reduce server costs? One company saved $47K monthly by moving from AWS to a combination of AWS and specialized database hosting, improving gross margins from 76% to 81%.
Support costs also impact margin. If you’re spending $30 per customer monthly on support, can you reduce that to $20 through better onboarding, improved documentation, or strategic automation? That $10 per customer flows directly to gross margin.
Specific tactic: Most companies should focus on Levers 1, 2, and 5 first. Gross margin optimization takes longer and yields smaller gains unless you have obvious inefficiencies. Don’t ignore it, but don’t start here.
Lever 4: Accelerate Time-to-Value
Faster activation leads to faster expansion, which effectively shortens payback even if initial ARPA stays constant. If you can get customers to their “aha moment” in 7 days instead of 21 days, they expand revenue faster.
Onboarding improvements drive this. One B2B SaaS company implemented structured onboarding with automated check-ins and reduced time-to-first-value from 19 days to 8 days. Their 30-day activation rate jumped from 64% to 81%, and those activated customers expanded 40% faster in the first year.
This lever works indirectly on payback by improving retention and expansion, which means your payback calculation becomes more conservative than reality. Better onboarding compounds over the customer lifetime.
Specific tactic: Measure time-to-first-value and time-to-full-activation separately. Create targeted interventions to reduce both. Automated onboarding sequences, human check-ins at critical moments, and clear success milestones all help.
Lever 5: Focus on Better-Fit Customers
Not all customers are created equal. Some pay back in 4 months; others never pay back. Tightening your ideal customer profile so you acquire more of the former and fewer of the latter improves payback dramatically.
Analyze your customer cohorts by characteristics: company size, industry, use case, initial contract value. Which cohorts have the best payback periods? Which have the highest LTV? Now look at your acquisition strategy are you targeting those segments intentionally, or are you taking whoever comes?
One company discovered their 50-200 employee customers had 7-month payback while sub-50 had 18-month payback. They refocused their entire go-to-market on 50-200 employee companies. CAC actually increased slightly (larger companies cost more to acquire), but ARPA jumped 60% and retention improved, cutting payback from 14 months to 8 months.
Specific tactic: Build a payback period analysis by customer segment. Rank segments by payback efficiency. Allocate 70% of your sales and marketing resources to the top two segments. This may mean saying no to customers who don’t fit that’s the point.
Red Flags: When to Sound the Alarm
Certain payback situations demand immediate action, not gradual improvement. Watch for these warning signs.
Your payback period is trending worse month-over-month. If you were at 11 months six months ago and you’re at 15 months today, you’re on a dangerous trajectory. This signals either rising acquisition costs or declining customer value. Stop and diagnose which before spending another dollar on growth.
Payback exceeds 24 months. This is almost always a crisis unless you’re in a rare category where it’s defensible (multi-year prepaid contracts, proven 5+ year LTV, patient capital that understands the model). For typical SaaS companies, 24+ months means your business model is broken. Fix the unit economics before pursuing growth.
Your payback period is longer than average customer lifetime. If customers churn after 20 months on average and your payback is 18 months, you have 2 months to make profit on each customer. That’s not a business that’s charity. You’ll never generate positive lifetime value. This requires an immediate pivot on either acquisition costs, pricing, or retention (ideally all three).
Your cash runway is shorter than (payback period × planned new customer volume). This is a cash crunch waiting to happen. If you have 12 months of runway, 15-month payback, and you’re planning to add 500 customers this year, your cash runs out before those customers become profitable. The math doesn’t work. You need to slow growth, raise money, or fix payback immediately.
Here’s your decision tree: Is payback under 12 months? Continue with current strategy. Is it 12-18 months? Evaluate capital requirements and optimization opportunities. Is it over 18 months? This is priority one fix it before doing anything else.
Calculating Your Own CAC Payback: Step-by-Step
Let’s walk through the actual calculation so you can do this for your company today.
Step 1: Gather your numbers from last quarter. You need total sales and marketing expenses (including salaries, tools, advertising, everything), number of new customers acquired, monthly recurring revenue from those new customers (not existing customers), and gross margin percentage (if you don’t know this, use 75% as a starting estimate).
Step 2: Calculate CAC. Take total sales and marketing expenses and divide by new customers acquired. If you spent $450,000 on sales and marketing last quarter and acquired 75 customers, your CAC is $6,000.
Step 3: Calculate monthly ARPA for new customers. Take the MRR from your new customer cohort and divide by the number of customers. If those 75 customers represent $18,750 in monthly recurring revenue, your ARPA is $250.
Step 4: Apply your gross margin. Multiply your ARPA by your gross margin percentage. If ARPA is $250 and gross margin is 80%, your monthly gross profit per customer is $200.
Step 5: Divide CAC by monthly gross profit. This is your payback period in months. $6,000 ÷ $200 = 30 months. That’s your answer.
Step 6: Interpret your result. Under 12 months is excellent. 12-18 months is manageable with proper capital planning. Over 18 months requires immediate attention and optimization.
Create a simple spreadsheet to track this monthly. Monitor the trend, not just the absolute number. A company improving from 16 months to 12 months is in better shape than one holding steady at 10 months but with deteriorating signals elsewhere.

What Investors Look For
Investors view CAC payback as a critical proxy for business model health and capital efficiency. Understanding their perspective helps you position your company effectively.
Early-stage VCs (Seed through Series A) typically accept 12-18 month payback if you’re in a large market and showing clear improvement trends. They know you’re still optimizing and finding product-market fit. What they care about is the trajectory. Show them you’re getting more efficient quarter over quarter.
Growth-stage investors (Series B and beyond) want to see sub-12 months. At this stage, you should have figured out your unit economics. If you’re raising a $30M Series B with 18-month payback, you better have an exceptional story about why (multi-year contracts, guaranteed expansion, something defensible).
Payback directly affects valuation multiples. Companies with 6-8 month payback command premium valuations because they’re capital-efficient growth machines. Those with 18+ month payback get discounted heavily because they require continuous capital infusions. The difference in valuation multiple can be 2-3x ARR or more.
Questions you’ll definitely get asked in diligence: “What’s your CAC payback by customer segment?” “How has payback trended over the last year?” “What’s your plan to improve it?” “How much capital do you need to support your growth plan given current payback?” Have these answers ready with data backing them up.
Key Takeaways
CAC payback period determines whether your growth is sustainable or suicidal. Under 12 months is the target for most SaaS companies anything beyond 18 months demands immediate action.
The biggest mistake is calculating it wrong. Include all acquisition costs, use gross margin (not gross revenue), segment by customer type, and track trends over time. A single point-in-time calculation means nothing without context.
Start by fixing what you measure. Once you know your real payback period across segments, focus on the three fastest levers: reducing CAC through channel optimization, increasing ARPA through pricing and packaging, and acquiring better-fit customers who pay back faster.
Revisit this metric monthly, not quarterly. CAC payback trends reveal business model health before your P&L does. By the time your cash flow statement shows a problem, it’s often too late to fix it without dramatic action. Monthly tracking gives you early warning signs and time to course-correct.
The companies that master CAC payback don’t just survive they’re the ones who can scale efficiently, reach profitability on their own terms, and build businesses that don’t depend on endless fundraising. That’s the difference between building a company and building a habit of raising money.

A SaaS analyst covering product strategy, growth, and customer experience in modern software businesses. Focused on practical insights and real-world SaaS execution.