Most SaaS teams think they are Product Analytics for SaaS is often misunderstood. Most SaaS teams think they are “data-driven” because they have dashboards.
They track traffic.
They track signups.
They track pageviews.
And yet they still don’t understand:
- Why users don’t activate
- Why upgrades stall
- Why churn keeps creeping up
- Why features don’t move revenue
That’s because pageviews don’t explain behavior. They only describe movement.
Product analytics is not about counting visits. It’s about understanding how your product is actually used.
If you want to build a SaaS that grows predictably, you need to track decisions, friction, intent, and outcomes not just clicks.
The Real Job of Product Analytics for SaaS
Product analytics exists for one reason:
To explain why growth happens or doesn’t happen inside the product.
Marketing analytics tells you how users arrive.
Sales analytics tells you how deals close.
Product analytics tells you what happens after users enter the product.
It answers questions like:
- Where do users get stuck?
- What actions predict long-term retention?
- Which behaviors lead to upgrades?
- Which features actually matter?
- What does “success” look like inside the product?
Without this layer, you are flying blind. You’re shipping features, redesigning flows, and changing pricing based on opinions instead of evidence.
Why Pageviews Are a Terrible Proxy for Product Health
Pageviews are easy to measure. That’s why everyone uses them.
But in SaaS:
- A user can view 50 pages and still get zero value
- Another user can perform 3 actions and become a long-term customer
Pageviews:
- Don’t measure progress
- Don’t measure success
- Don’t measure friction
- Don’t measure value
They only measure movement.
Product growth doesn’t come from movement. It comes from outcomes.
The Four Categories of Signals You Actually Need
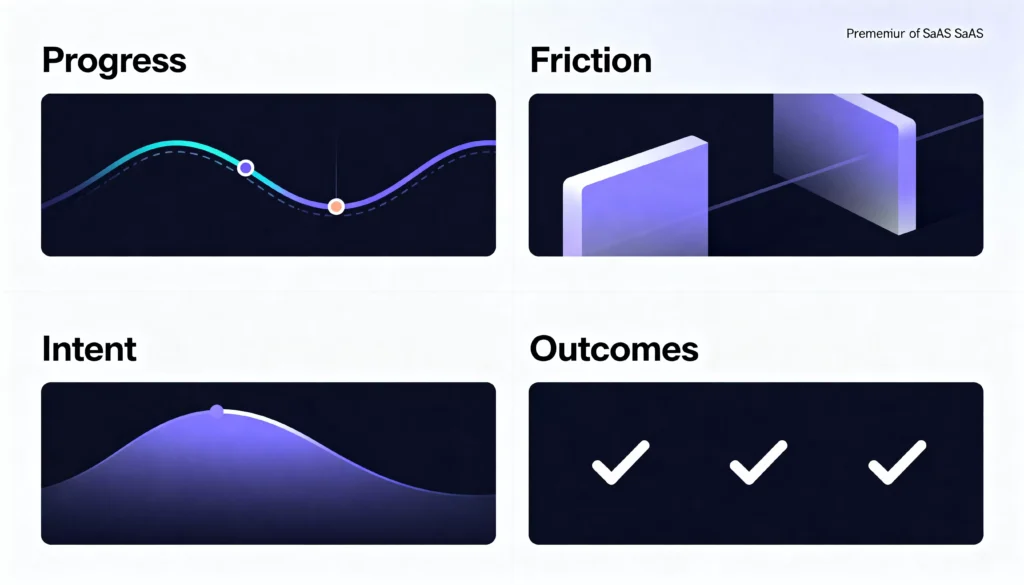
If you strip product analytics down to its essence, you’re trying to measure four things:
- Progress – Is the user moving toward value?
- Friction – Where do they slow down, hesitate, or quit?
- Intent – Are they behaving like a serious user or a tourist?
- Outcomes – Did they actually get the result your product promises?
Everything you track should serve one of these four purposes.
1. Activation Signals (The “Did They Get It?” Layer)
Activation is the moment when a user experiences the core value of your product for the first time.
This is rarely:
- Creating an account
- Verifying email
- Opening the dashboard
Real activation is:
- Creating the first project
- Importing the first dataset
- Sending the first campaign
- Inviting the first teammate
- Publishing the first asset
Good product analytics tracks:
- How long it takes to reach activation
- How many users reach it
- Which steps block it
- Which actions predict success
If you don’t know what action creates the “aha moment”, you don’t have a product you have a website.
2. Engagement Signals (The “Are They Actually Using It?” Layer)
Not all usage is equal.
Logging in is not engagement.
Clicking around is not engagement.
Staring at the dashboard is not engagement.
Engagement is:
- Repeating meaningful actions
- Using core features
- Returning with a purpose
- Building habits around the product
Good engagement signals look like:
- Number of projects created
- Number of workflows completed
- Number of key actions per week
- Breadth of feature usage
- Depth of usage in core areas
This tells you:
- Who is building dependency
- Who is drifting
- Who is likely to saas churn
- Who is ready to expand
3. Friction Signals (The “Where Are We Losing Them?” Layer)
Every product has silent killers:
- Confusing flows
- Slow steps
- Broken mental models
- Overwhelming screens
- Poor defaults
Most teams don’t see them because users don’t complain they leave.
You should track:
- Where users abandon key flows
- Where they hesitate or loop
- Where they repeat actions unnecessarily
- Where they drop out of onboarding
- Where they fail and don’t retry
Friction analytics tells you what to fix first, not what feels important.
4. Value Realization Signals (The “Did We Deliver the Promise?” Layer)
This is the most ignored layer in SaaS analytics.
Your product promises an outcome:
- Save time
- Make money
- Reduce errors
- Improve visibility
- Simplify work
You should track:
- Did the user achieve that outcome?
- How long did it take?
- How often does it happen?
- Does it repeat?
If users don’t reach outcomes, no amount of UX or marketing will save you.
The Difference Between Tracking Actions and Tracking Meaning
Bad product analytics:
- Tracks everything
- Measures clicks
- Builds busy dashboards
- Answers no strategic questions
Good product analytics:
- Tracks only meaningful actions
- Maps actions to user success
- Connects behavior to retention and revenue
- Helps teams decide what to build, fix, or remove
Before tracking any event, ask:
“If this number changes, what decision will we make?”
If there is no answer don’t track it.
How Product Analytics Supports Every Growth Decision
When done right, product analytics becomes the nervous system of your SaaS:
- Product uses it to prioritize roadmap
- Growth uses it to optimize activation
- Marketing uses it to understand ICP behavior
- Sales uses it to spot expansion signals
- Success uses it to prevent churn
It stops debates from being:
“I think users want this”
And turns them into:
“The data shows users who do X retain 3x longer”
The Maturity Curve: From Counting to Understanding
Most SaaS companies evolve like this:
Stage 1: Track traffic and signups
Stage 2: Track features and clicks
Stage 3: Track journeys and outcomes
Stage 4: Track behavior patterns and predict growth
Your goal is not to have more data.
Your goal is to have better questions.
The Real Competitive Advantage
Features can be copied.
Pricing can be matched.
Design can be replicated.
But deep understanding of user behavior compounds over time.
Teams that understand:
- Why users succeed
- Why users fail
- Why users upgrade
- Why users leave
…will always build better products.
If your product analytics is still centered around:
- Pageviews
- Logins
- Generic dashboards
You are measuring activity, not progress.
Start measuring:
- Activation
- Engagement
- Friction
- Outcomes
That’s how real SaaS products are built.

A SaaS analyst covering product strategy, growth, and customer experience in modern software businesses. Focused on practical insights and real-world SaaS execution.